IntelliJ Extra WildFly Log Files
August 21, 2019
This is a productivity tip for doing WildFly development with IntelliJ. By default, when you add an app server Run/Debug Configuration, the messages piped to the ConsoleHandler gets routed to a dedicated Output pane in the IDE. These messages scroll so that you can see new ones come in as you operate the web app or service. Sometimes, the log gets so cluttered that you need to involve a second file that focus on specific messages. Like the Output pane, this secondary log file can be configured in the same way.
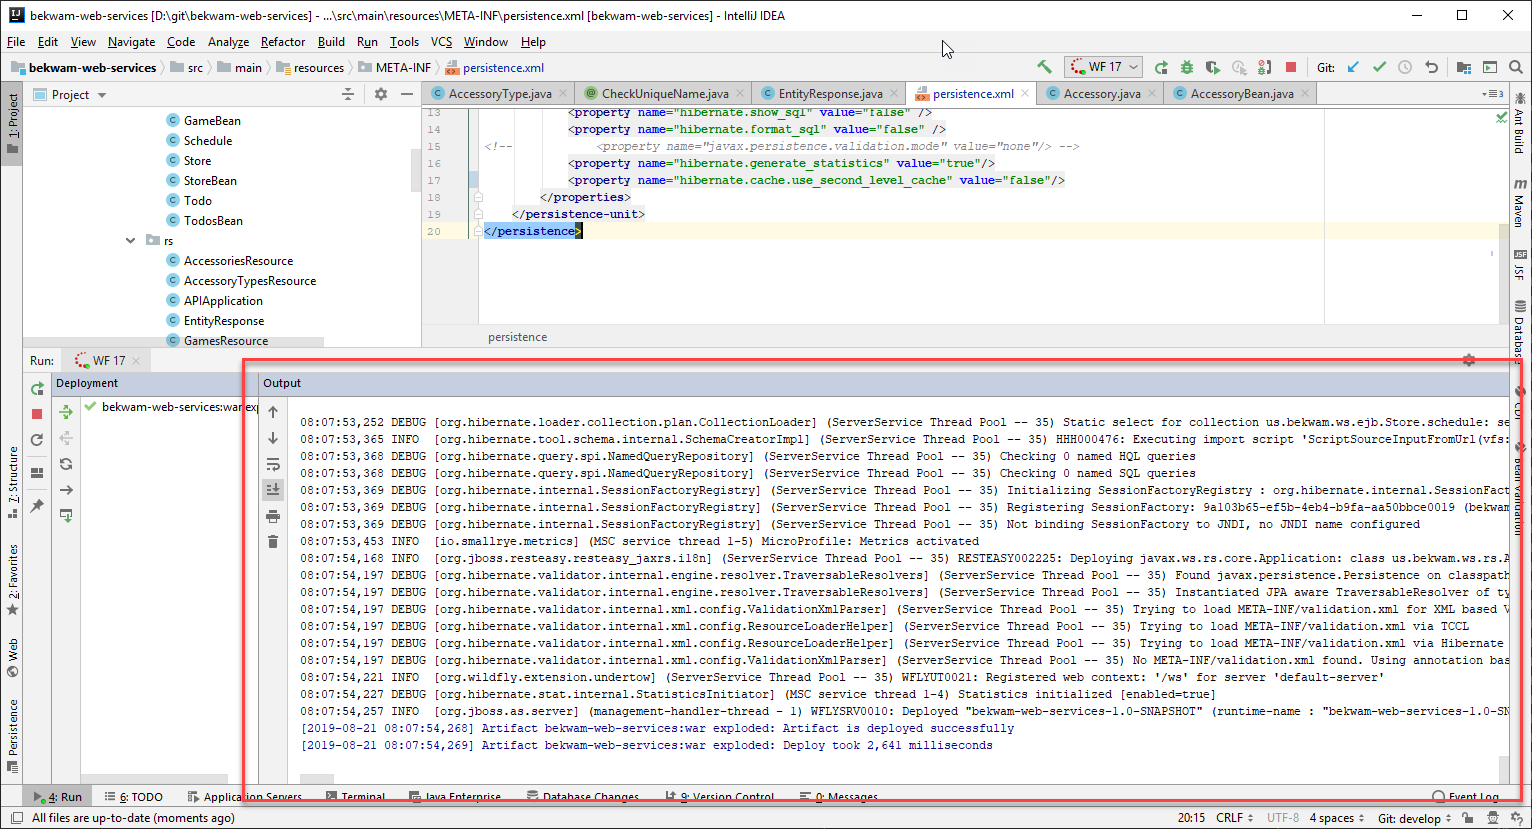
This screenshot shows the Output pane. It's displayed as part of the Application Servers Tool Window.

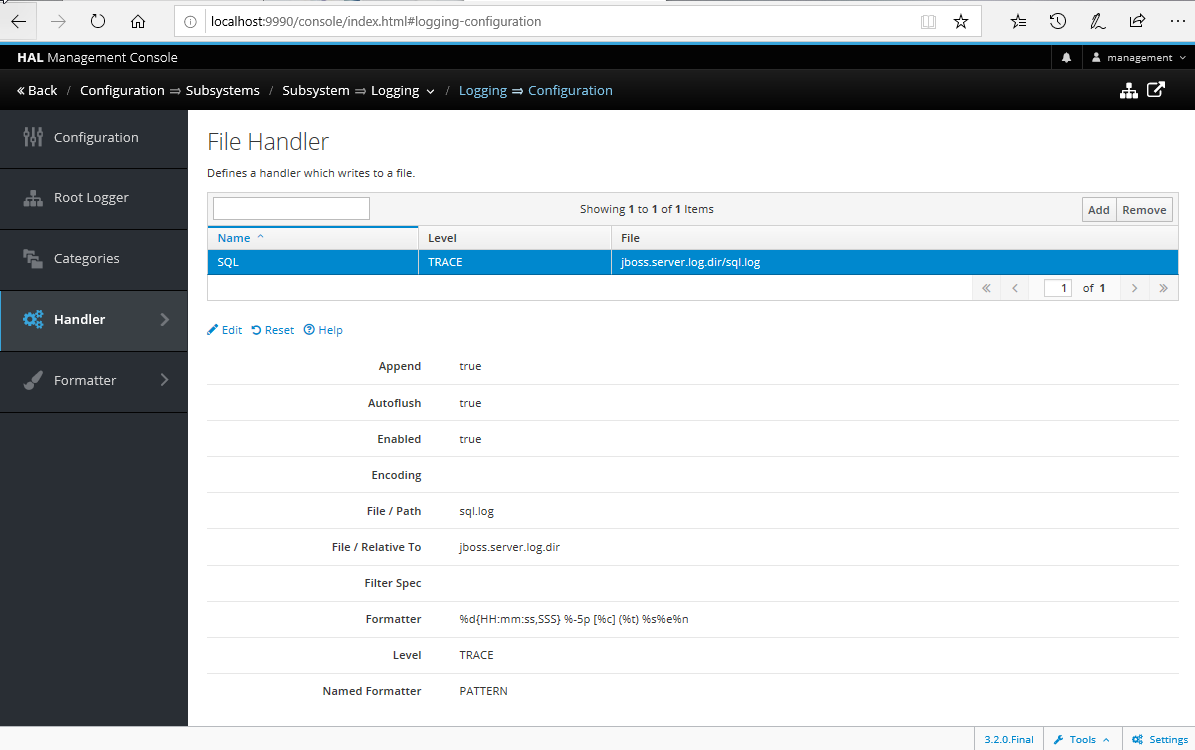
In this article, I am going to send the SQL generated by JPA/Hibernate commands to a dedicated log file. The file is sql.log and it lives in the WildFly /log folder. I've named its handler "SQL".

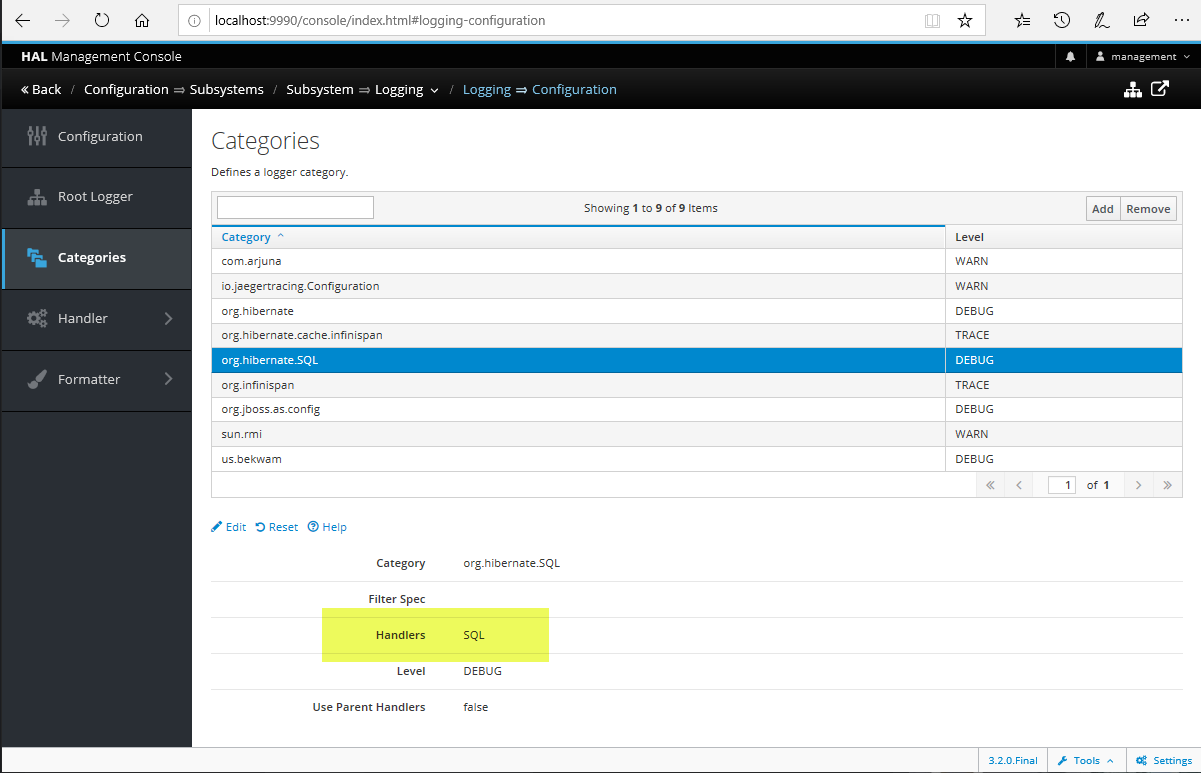
A category is then created which will route specific messages to the log file. In this case, org.hibernate.SQL will send the SQL statements used in my app testing to sql.log.

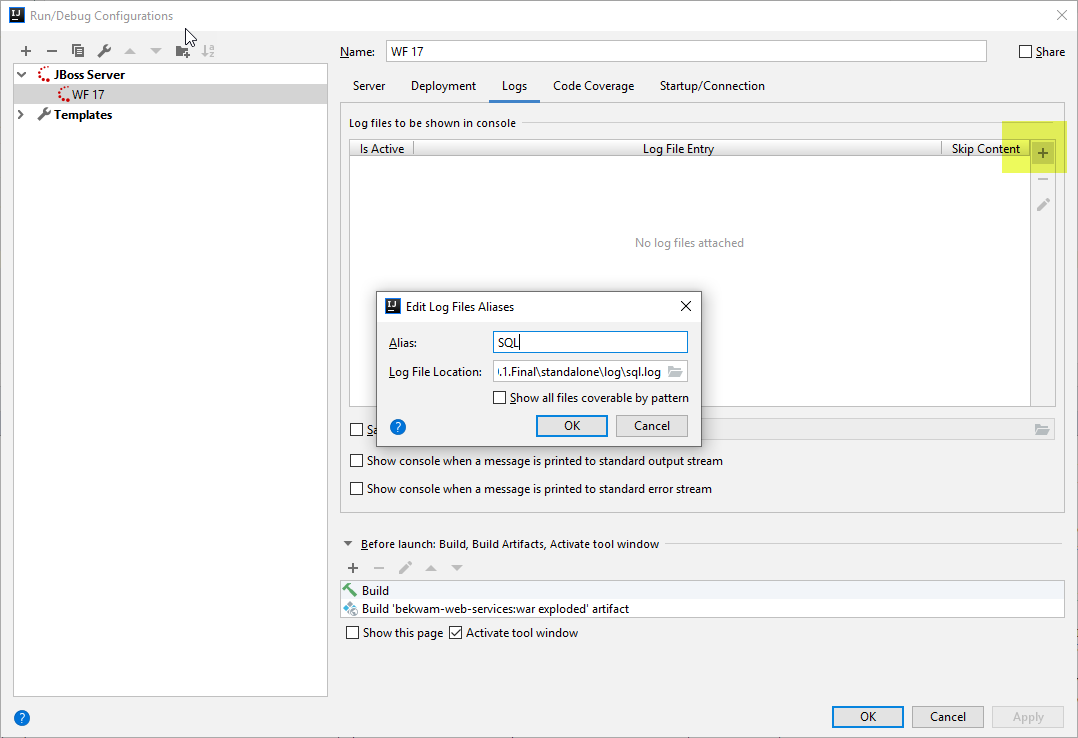
Next, register this new file with IntelliJ. Open the Run/Debug Configuration for your app server and navigate to the Logs tab. Press the + button in the upper right corner and find the log file. I'm giving this an alias of "SQL" which will be displayed in the pane title.

I prefer the Skip Content setting which makes sure that the file displays only the messages since the current restart. Uncheck this if you want the entire file to appear in the tab. Restart the app server for the new tab to display. This screenshot shows the resulting SQL activity piped.

This producer can be repeated for other categories. For instance, you might organize several log files around your technology stack: one for RESTful services, one for EJBs, one for JPA/Hibernate. Integrating this into IntelliJ means that you're juggling one fewer window and helps hone in the messages you care about.

By Carl Walker
President and Principal Consultant of Bekwam, Inc