EE Stuff - 001 RC Circuit
September 2, 2017
This article shows how to calculate the time constant of an RC (resistor-capacitor) circuit and how to verify the time constant value using an oscilloscope. In an RC circuit with direct current, the voltage across the resistor immediately becomes DC maximum when the power is turned on. When the power is turned off, the voltage immediately falls to 0.
This isn't the case with the capacitor. There is a delay to reach the maximum capacitor voltage and a delay in falling to 0. This delay is measured in units called time constants which are denoted with the Greek Tau Τ.
Schematic
In the following circuit, a 1kΩ is in series with a 10μF electrolytic capacitor. There is a switch between the DC power source and the resistor.
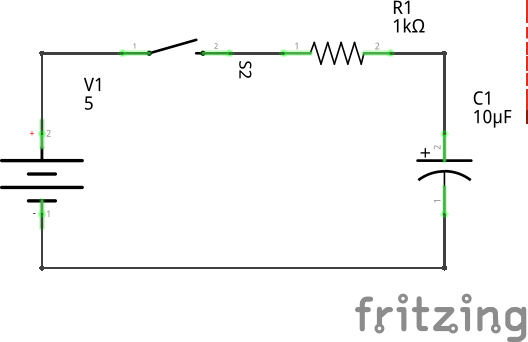
To find the time constant, use the formula ET = R x C. This is
1 x 103 x 10 x 10-6 = 10 x 10-3 s = 10 ms
Charging
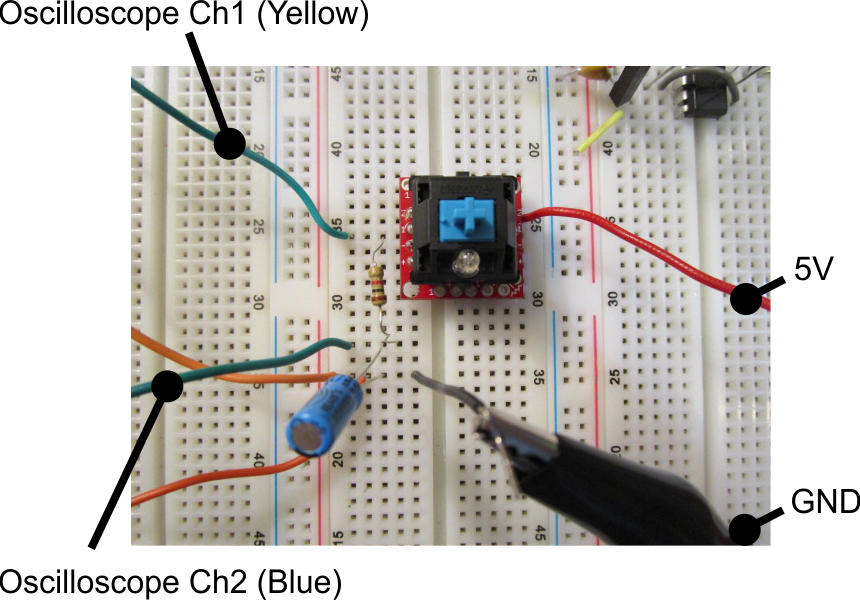
The following screenshot shows an implementation of the schematic on a breadboard. An off-screen DC power source provides 5V to the circuit. See the 5V and GND annotations to the right of the diagram. The 5V source is connected to a Cherry MX Blue switch on a breakout board. The switch is connected to a resistor which is then connected to a capacitor. There are oscilloscope leads for testing ER and EC.
Pressing the switch will close the circuit and current will begin to flow. This oscilloscope screen shot captures the event. Yellow is Ch1 and is measuring ER. It immediately goes to 5V. The arcing, exponential Blue Ch2 is measuring EC. Eventually, it reaches 5V, but there is a delay.

This delay is very quick, computed at 10ms earlier, and I can't set the cursors that fast. So, I set a trigger on the oscilloscope to capture the reaction to the pressing of the switch. The trigger is set to record the leading edge of Ch2 (EC). You can see the orange "T" along the right side at 2.66V.
With the graphs captured, I set the horizontal (left-to-right lines) cursors first. I put the beginning cursor at 0V and move the top cursor to about 63.2% of the maximum value (5 x 63.2% = 3.16V). I set the cursor by eyeballing it so the top line is at 3.2V.
Next, I set the vertical (top-to-bottom lines) cursors. I set the leftmost cursor to the start of the event which is the point at which Ch1 (ER) goes to 5V. I then move the right cursor to intersect Ch2 (EC) and the topmost horizontal cursor. Looking at the BX-AX value I can see that the distance between the left and right vertical cursors is 10.60ms which is close to my computed value of 10ms. I wasn't particularly precise in operating the oscilliscope which explains the 0.60ms difference.
Discharging
The oscilloscope can also meaure the time constant when the capacitor is discharging. In this case, the trigger needs to be set to a falling edge. The vertical cursor positioning will be based on 36.8%.
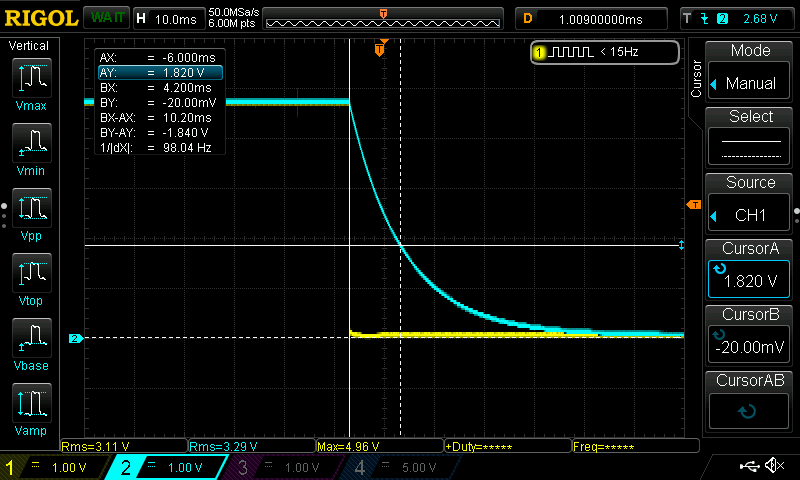
The value of 10.20ms is sufficently close to the computed 10ms value.
Calculating the time constant of an RC circuit is a simple multiplication of R and C. This article then verified the computed value using an oscilloscope. Using a Rigol DS1054, a trigger was set to capture the switch on event. With the graph captured, cursors were added to measure the time it took for EC to reach 63.2% of the maximum value when charging.
If you have any questions or found an error, feel free to send email to webmaster@bekwam.com.

By Carl Walker
President and Principal Consultant of Bekwam, Inc